

Markets
Put the next pound to work.
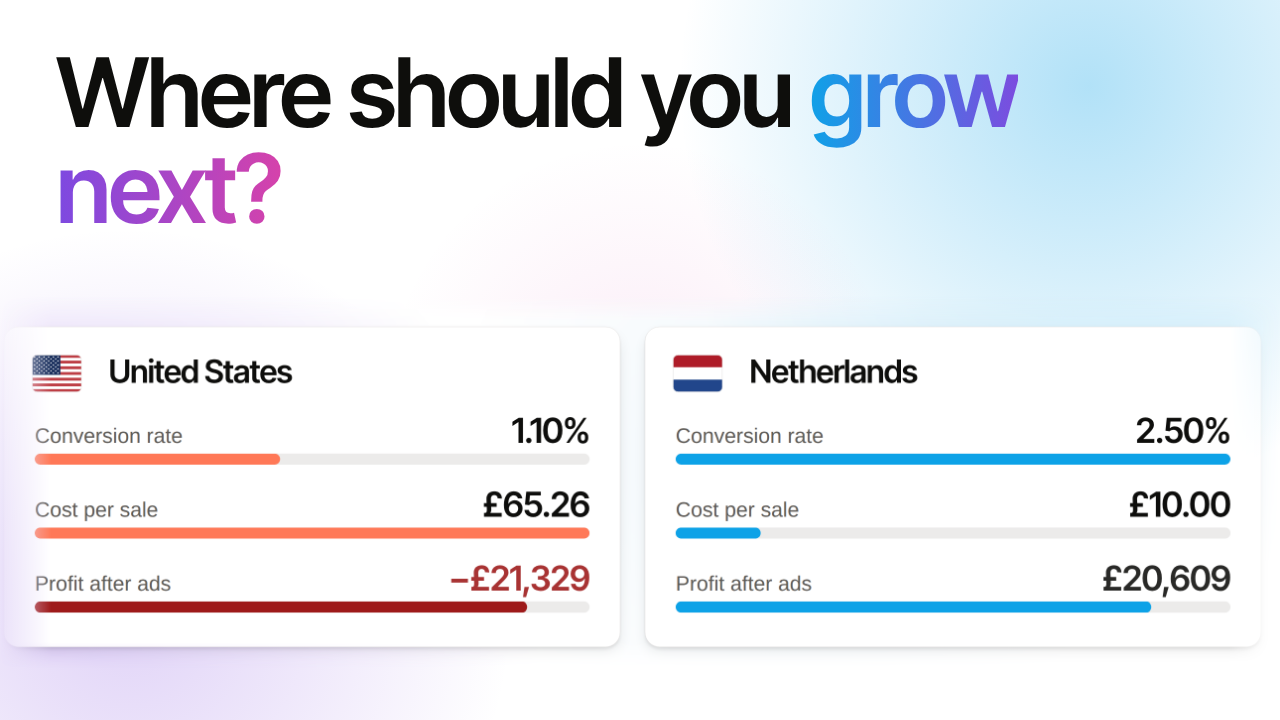
Every country you sell to, side by side, with a call on where the next pound should go or a plain reason there is not one yet.
On the Dashboard
Every market and its verdict.
Each market's share of net sales sits on the Dashboard with its verdict, shown only when there are enough orders to judge.
- Share of net sales by delivery country
- A verdict only with enough orders behind it

Profit by market
What each market leaves.
Read the P&L by market to see what each country leaves after shipping and the ad spend delivered there.
- The P&L by market
- Price moves and targeting changes on the timeline

Questions
Does it use Shopify Markets?
Markets are countries in Fabrik today, not Shopify Markets groups.
Are fixed costs split by market?
No. The market view is after shipping and ad spend; fixed costs are not allocated to markets.


See where your next pound should go.
Connect Shopify, Meta and Google Ads, and your last 12 months by country start arriving straight away.