Which products earn after they come back.
Return rate against each category's norm, margin by variant, entry products that bring customers back, and new lines with no traction.

What this team gets on its list
- Check the fit on a product returning far above its categoryAbove-average return rate
- Give a new line help, or let it goNew product traction
- Look again at a range that leans on too few productsProduct risk
Questions this team asks every week
- Which products come back far more often than the rest of their category?
- Which variants carry the style, and which drag its margin down?
- Which first products bring customers back for a second order?
- Which new lines are not getting traction?
The numbers this team runs on
Return rate against category
Products returning well above their category's norm, often a fit signal.
Variant margin
Margin per variant inside a single style.
Entry products
The first purchases that bring customers back, and the comeback rate each brings.
New-product traction
New lines with no traction flagged early, so they get help or get out.
Revenue by range
Range-level reads for review meetings.
Profit after returns
Every product's margin once refunds, costs and ads come off.
The capabilities this team uses
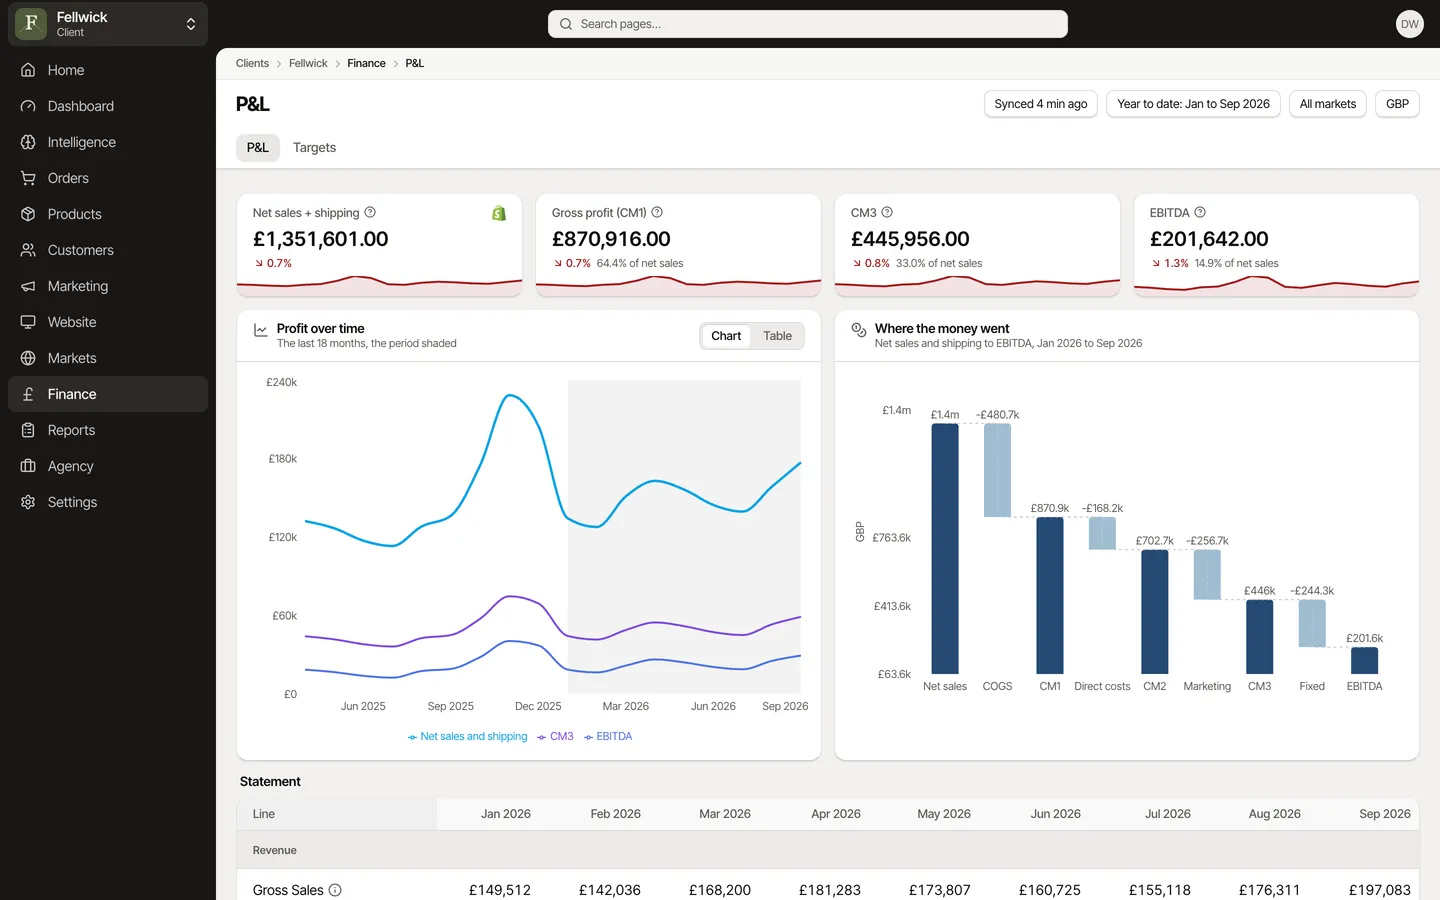
Finance
A real P&L from gross sales to EBITDA, and targets that follow how your year trades.
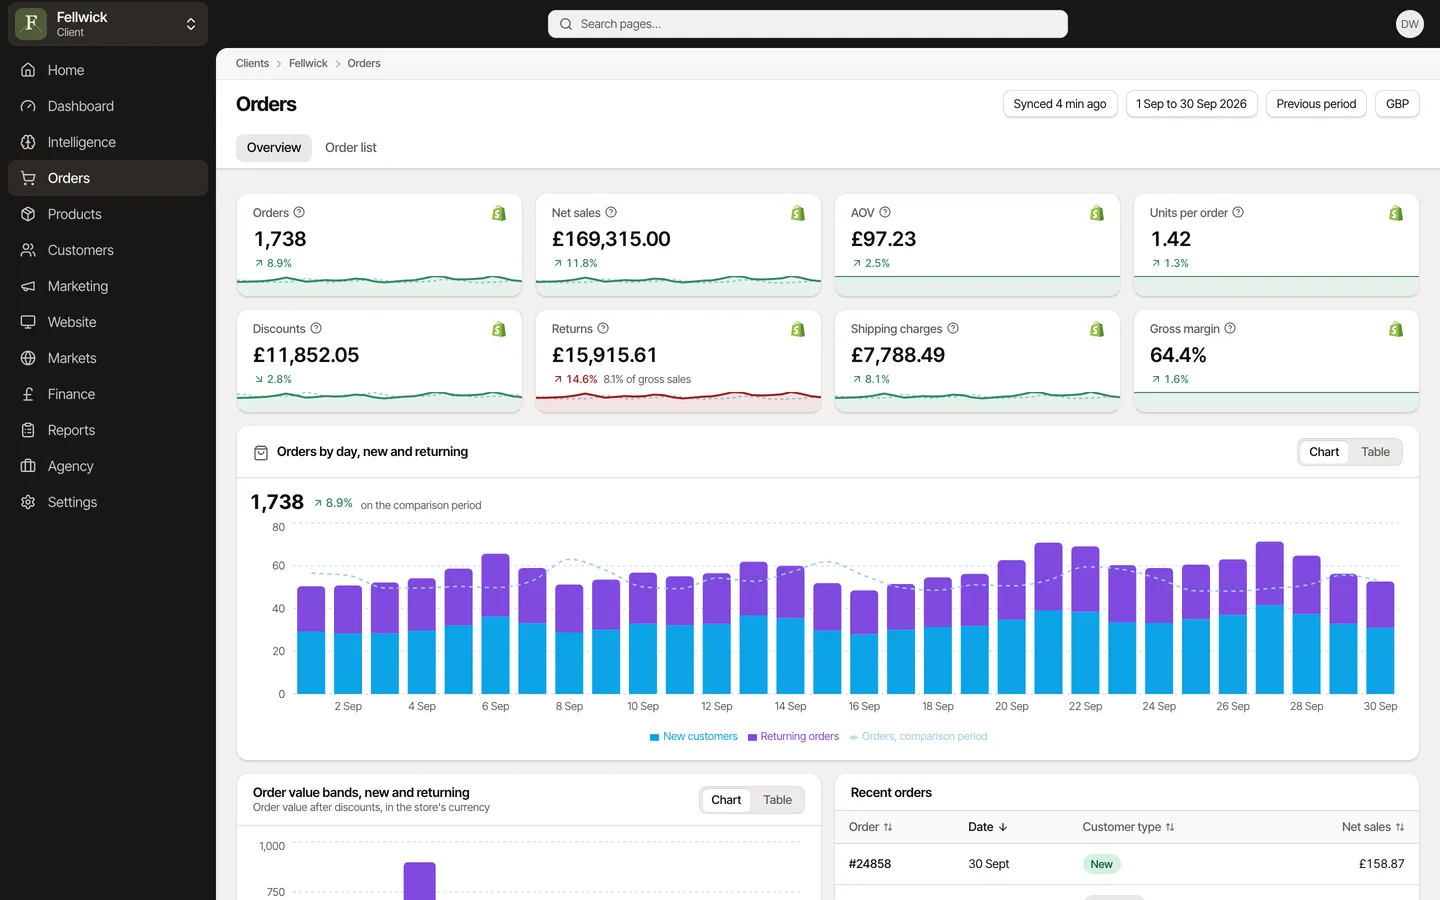
Orders and customers
Every order with its profit and channel, and the customers who come back.
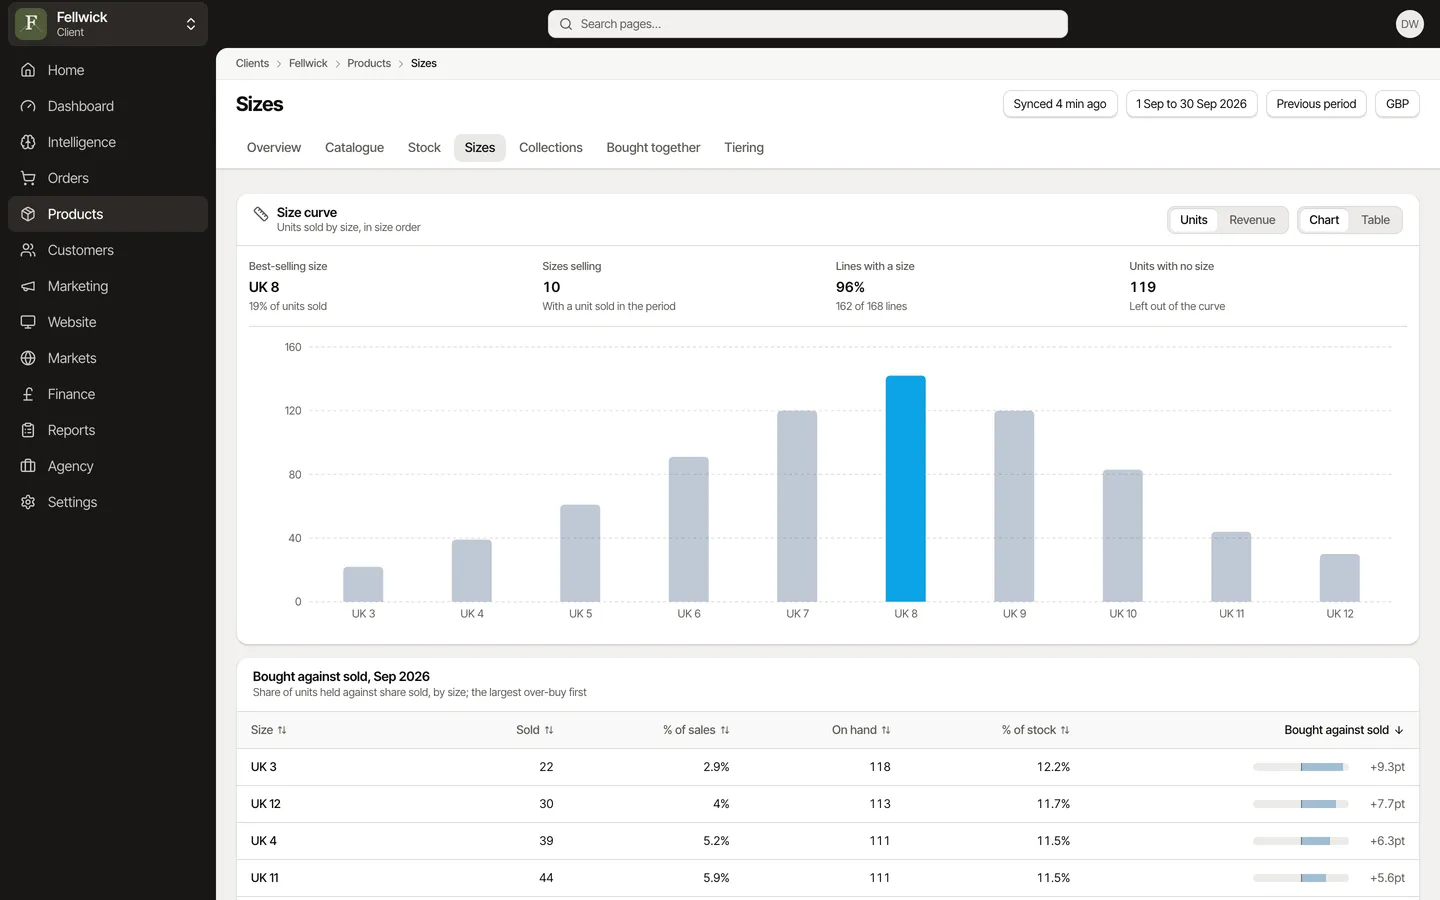
Products
Sell-through, cover and size curves for every line, and what to reorder.
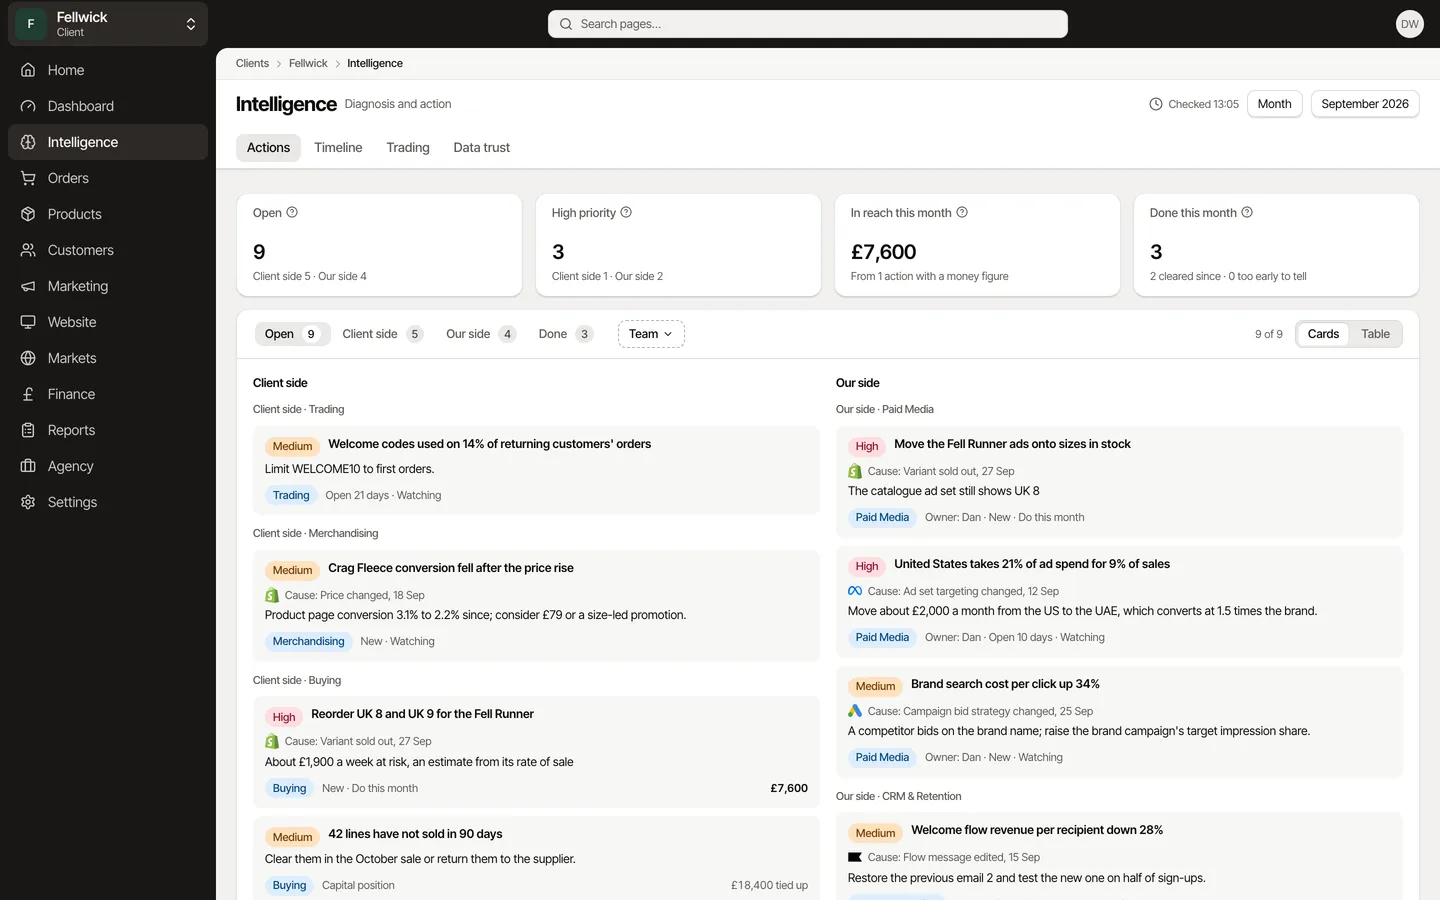
Intelligence
Each team's list every morning, ranked by the money within reach.


Does it read return reasons?
No. It measures return rate against each category's norm, which points at the products to check.