Stock that runs out on purpose, not by surprise.
Weeks of cover by size, reorder quantities within lead time and minimums, stock changes on the timeline and integrations that say when they fail.

What this team gets on its list
- Reorder before cover runs under lead timeReorder planning
- Replace a key size that sold outKey sizes out of stock
- Clear stock that has stopped movingDead stock
- Fix a feed that is late or failingData checks
Questions this team asks every week
- Which sizes run out before the next delivery lands?
- What do we reorder, and how many, within lead time and minimum order?
- How much cash is tied up in stock that has stopped moving?
- Did every feed sync last night?
The numbers this team runs on
Weeks of cover by size
Cover on the recent rate of sale, for every size of every product.
Lead time and minimum order
Supplier constraints applied to every reorder suggestion.
Dead stock value
Cash tied up in units that stopped moving, at cost and at retail.
Stock on the timeline
Stock changes sit on the same line as sales, ads and sends.
Connection checks
Every integration tested hourly, and sync history per platform.
Return rate against category
Products returning well above their category's norm.
The capabilities this team uses
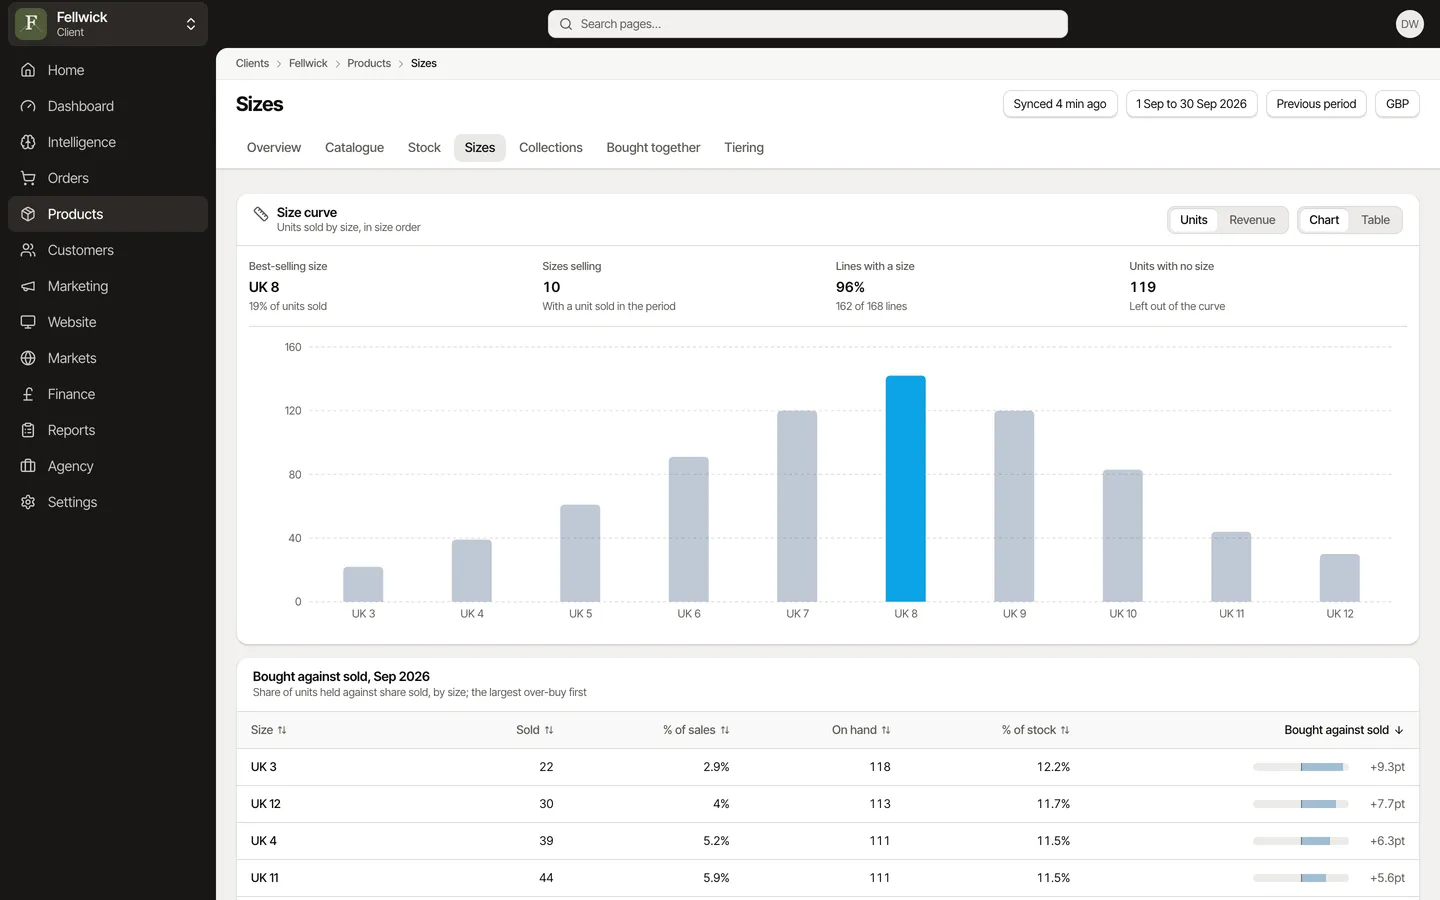
Products
Sell-through, cover and size curves for every line, and what to reorder.
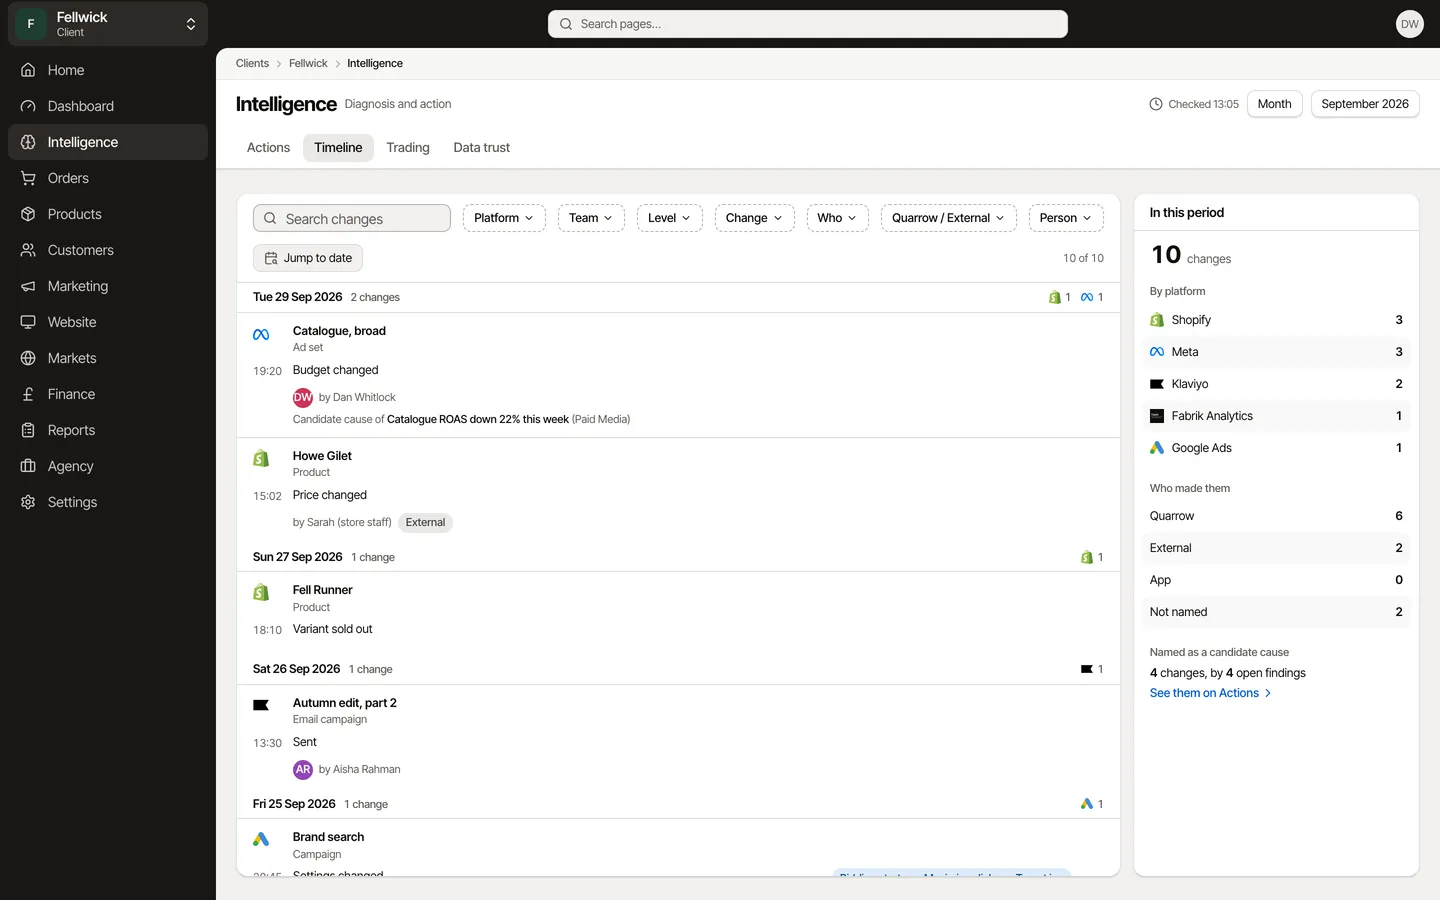
Timeline
Every change to the store, ads and email, who made it and why.
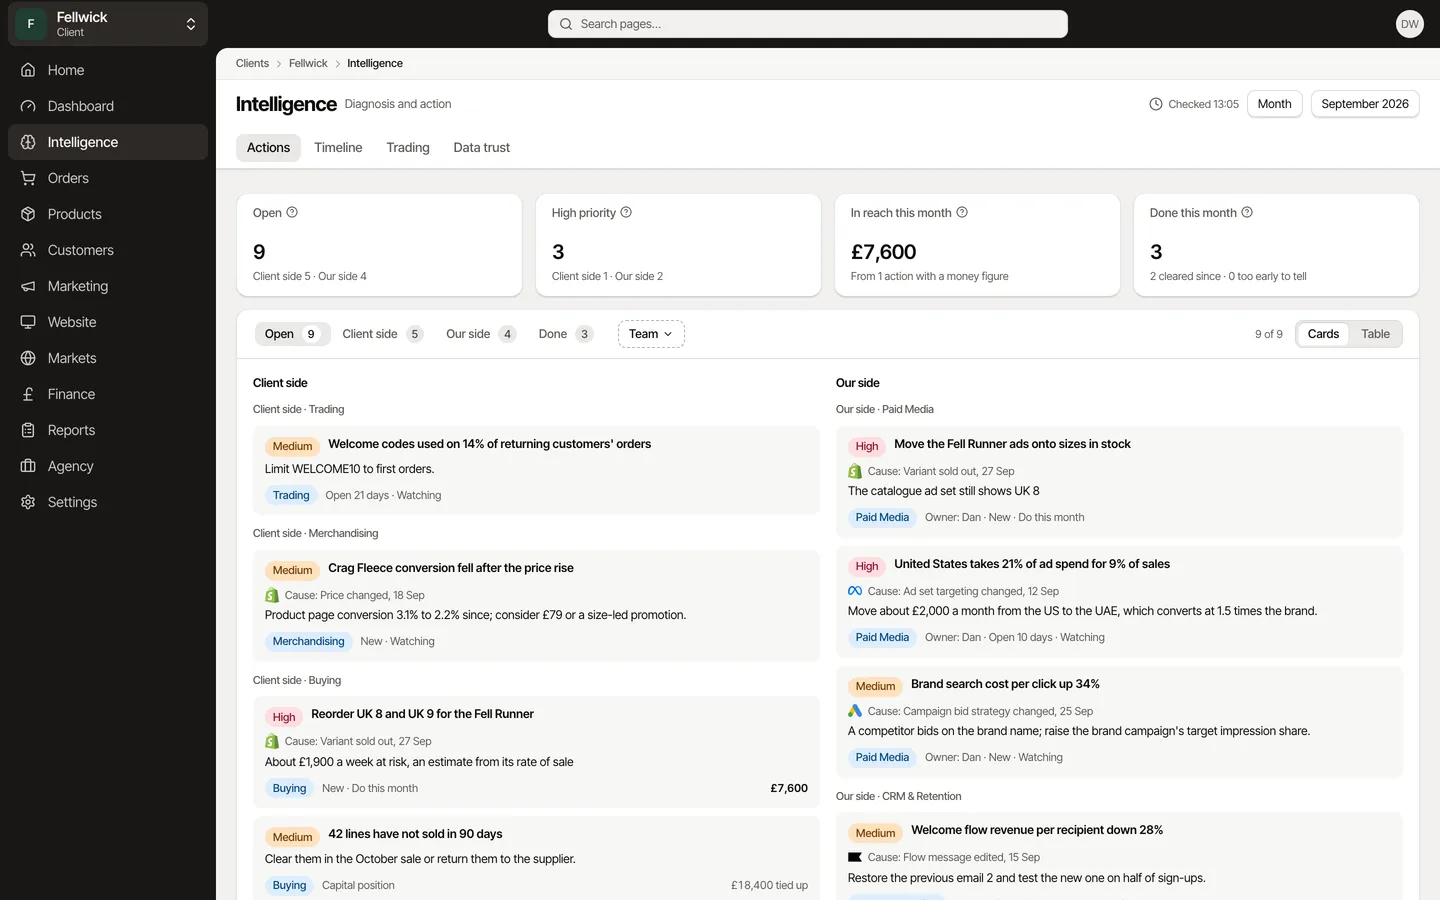
Intelligence
Each team's list every morning, ranked by the money within reach.
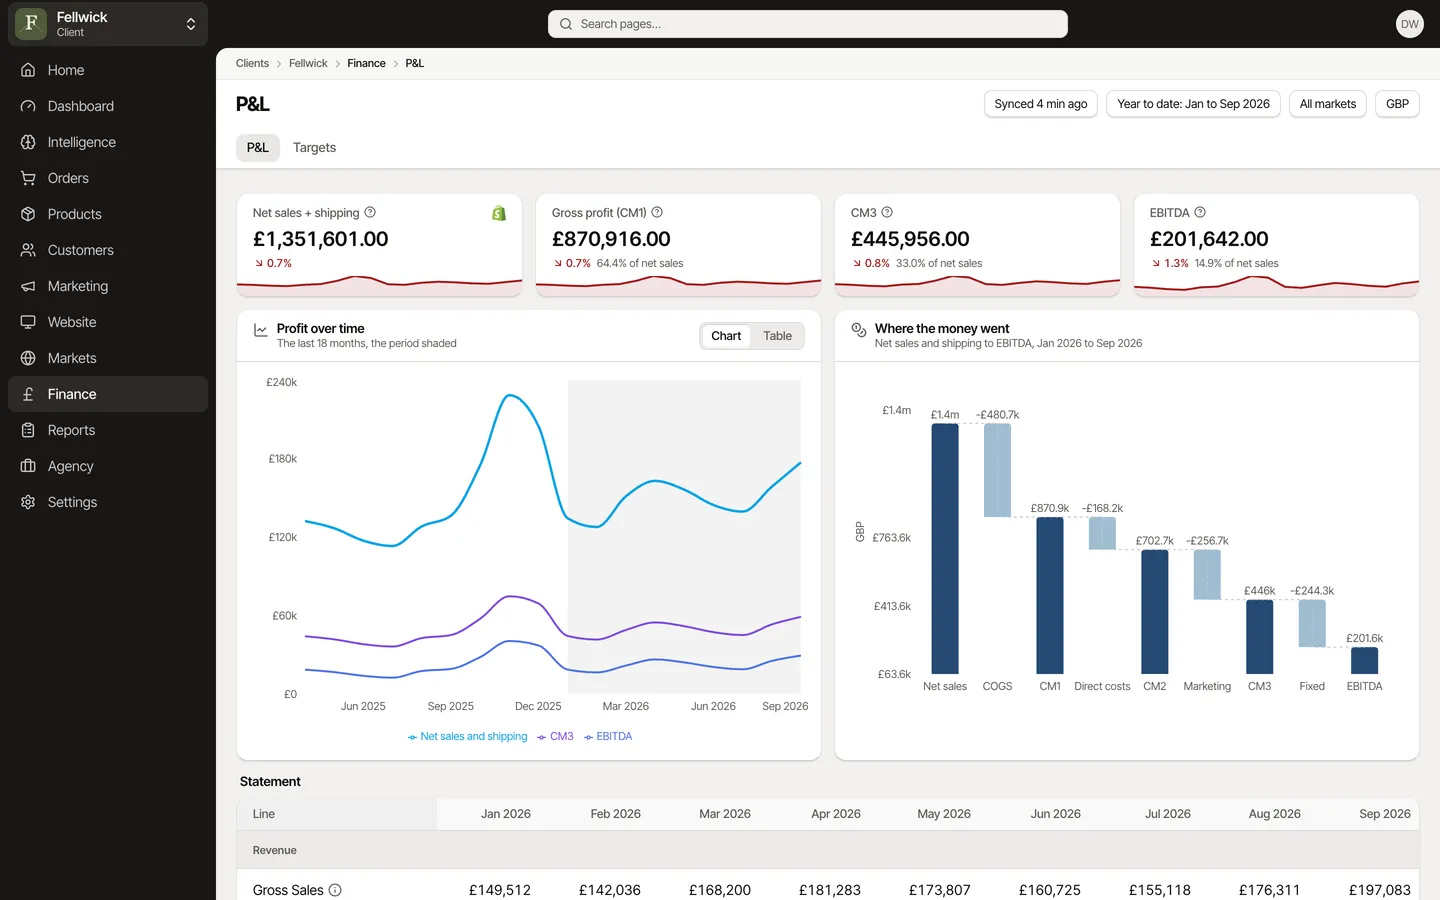
Finance
A real P&L from gross sales to EBITDA, and targets that follow how your year trades.


How are stock changes recorded?
Stock is read with every sync and put on the timeline when it changes; stock value is snapshotted every night.