Buy to the curve you actually sell.
Size curves, size-run gaps, tiers that write back to Shopify, reorders within lead time and dead stock valued at cost.

What this team gets on its list
- Reorder a key size that sold outKey sizes out of stock
- Rebalance a line whose size run is offSize run imbalance
- Check a curve that leans on one sizeSize curve concentration
- Rethink a size curve that has movedSize demand has shifted
- Reorder within lead time and minimumsReorder planning
Questions this team asks every week
- Which sizes sell faster than we bought them?
- Which selling lines have holes in their size run?
- What should we reorder this week, at what quantity, given lead time and minimum order?
- What is dead, and how much cash is sitting in it?
The numbers this team runs on
Bought against sold, by size
Units and revenue by size, against the curve you bought.
Size-run gaps
Every selling line with part of its size run unavailable, and the units left.
Tiers that write back
Hero, Growth, Maintain, Liquidate, Dormant and New, written to Shopify as tags.
Reorders within lead time
Quantities per variant that respect supplier lead time and minimum order.
Dead stock at cost
Lines with no sales, or more than six months of cover, valued at cost and at retail.
Bought together
On Pro, the products bought together, published to your product pages.
The capabilities this team uses
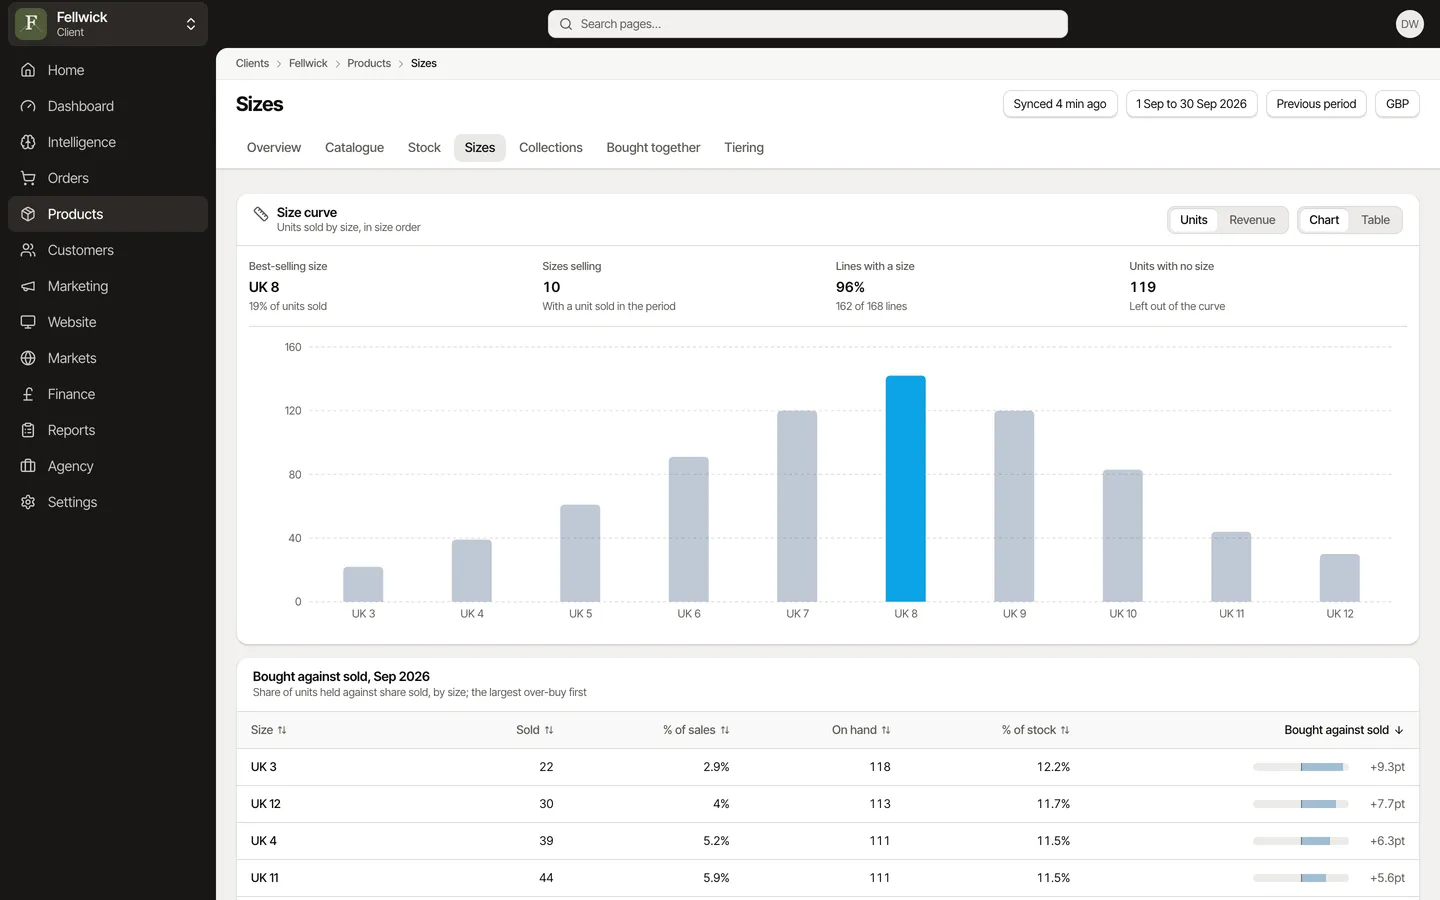
Products
Sell-through, cover and size curves for every line, and what to reorder.
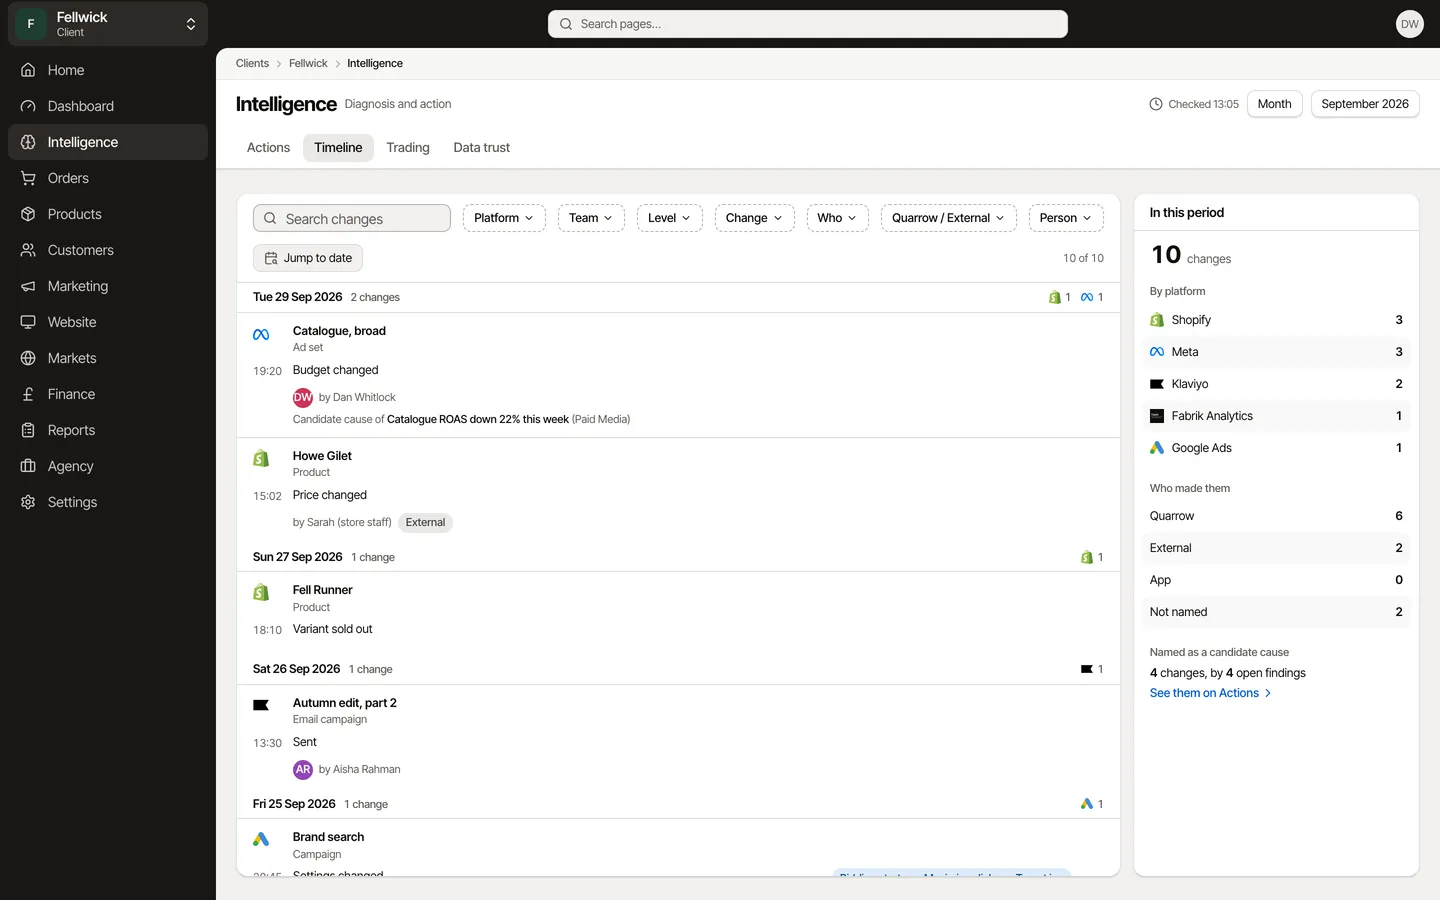
Timeline
Every change to the store, ads and email, who made it and why.
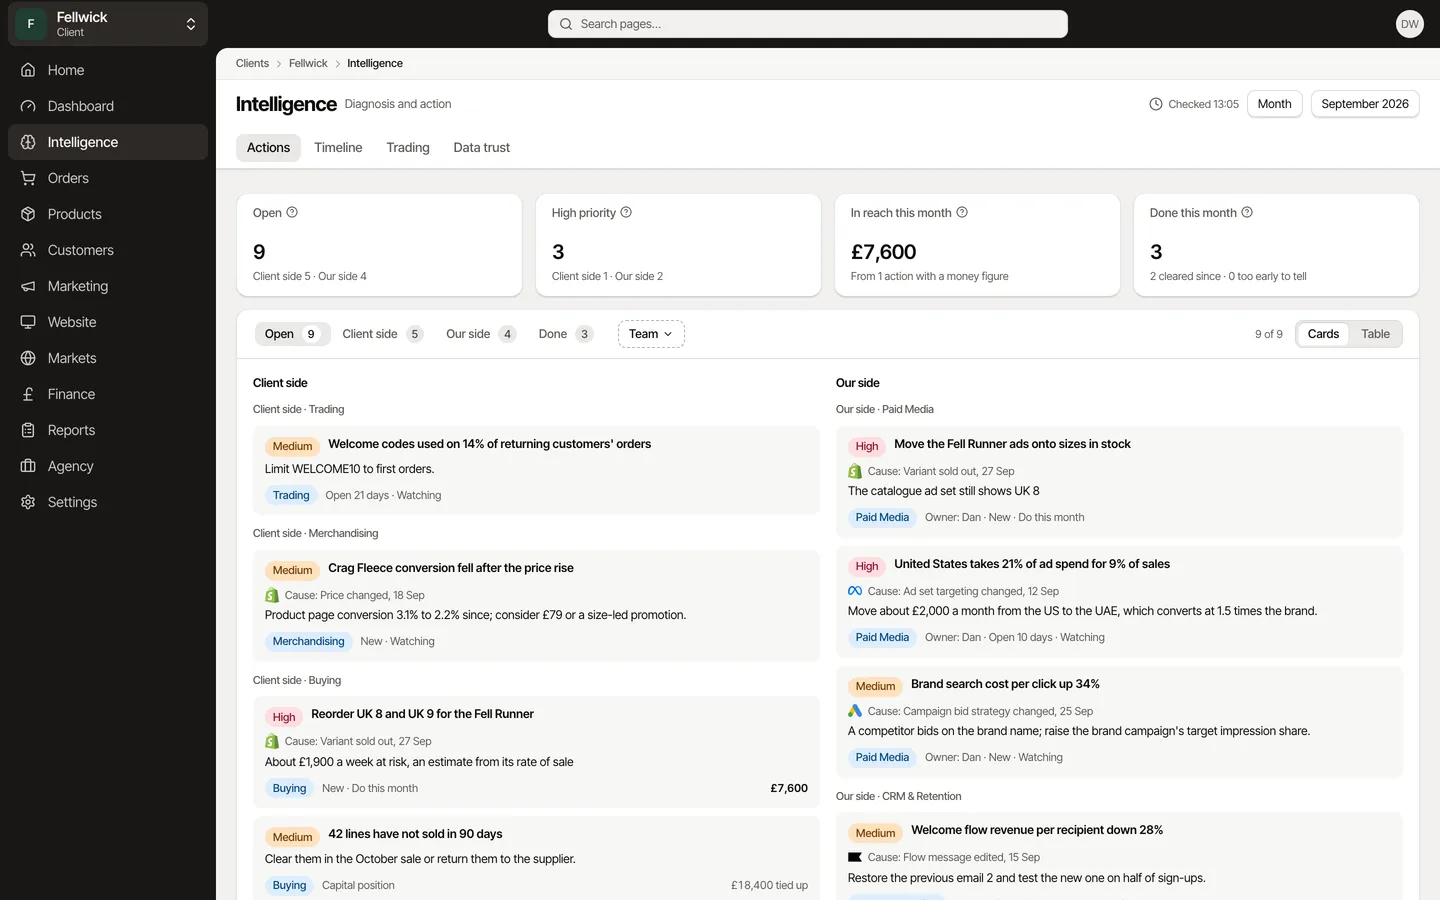
Intelligence
Each team's list every morning, ranked by the money within reach.
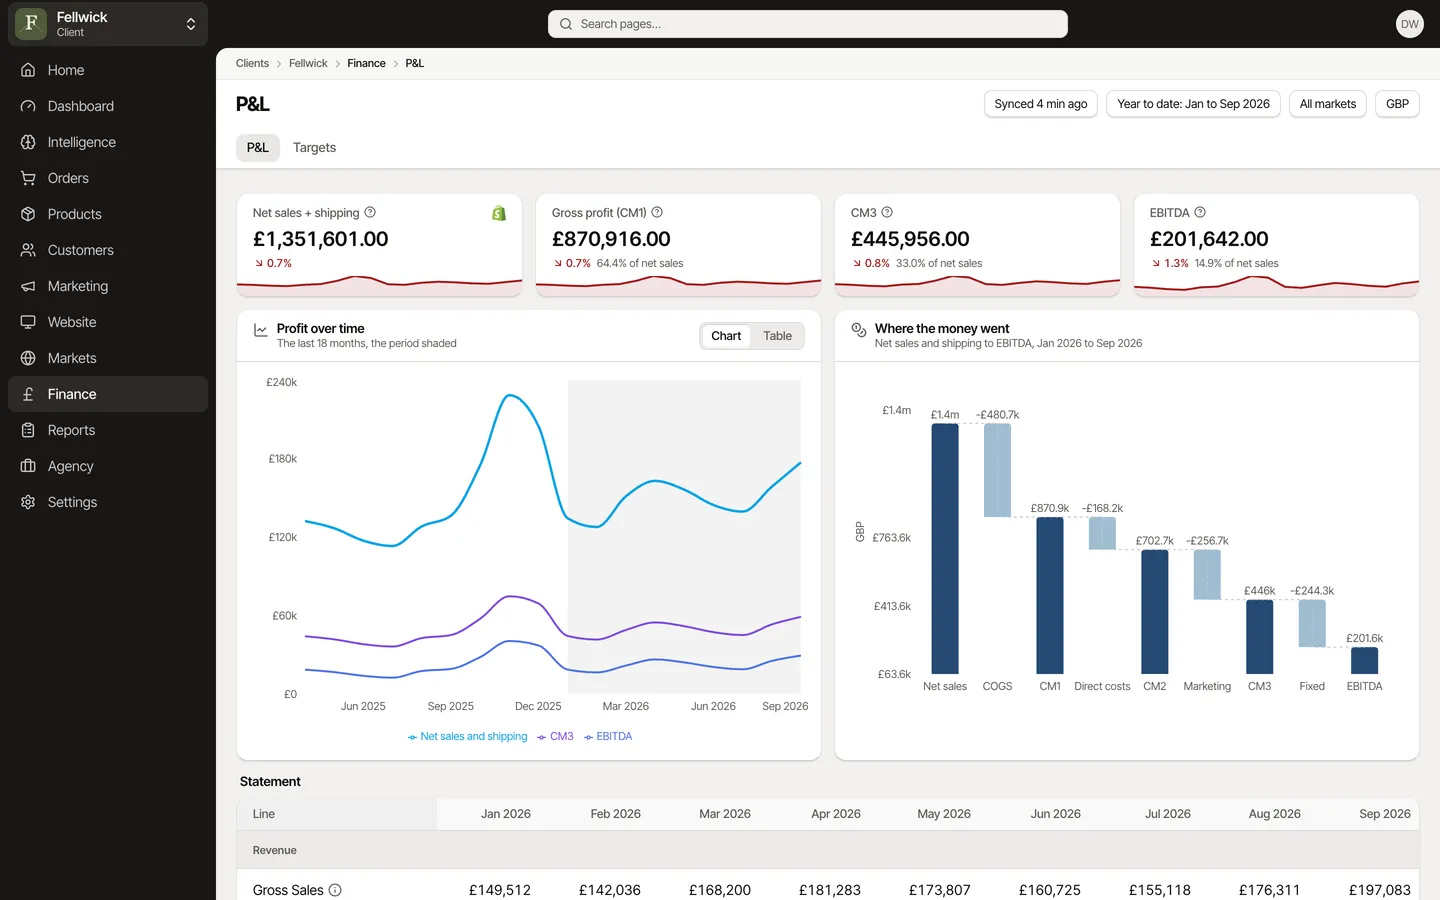
Finance
A real P&L from gross sales to EBITDA, and targets that follow how your year trades.


Does it plan next season's buy?
No. It shows the curve you sold against the curve you bought, and reorder quantities per variant; the season plan stays with your buyers.